Planning for an overseas market? Choose your country and local setup route. Check where you operate separately from where your customers live.
A weekly measurement sheet and one evidence-based improvement.
Clicks indicate an action. They do not establish a sale or paid income.
Define the steps before counting them
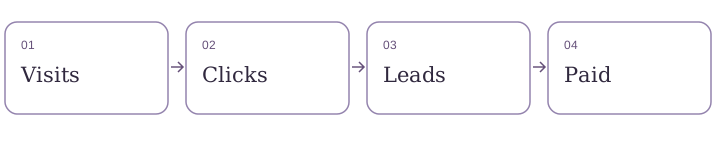
For an affiliate article, a useful journey is article visit, recommendation click, platform registration, qualifying purchase and eventually paid commission. Those events happen in different systems. A website click does not prove a signup, and an approved commission is not the same as money received.
For your own service, the steps may be page visit, enquiry, qualified conversation and agreed work. Choose the journey that matches the page. Avoid reporting newsletter subscribers and paying customers as one combined “conversion” number.
Build a simple weekly sheet
Record the date range, timezone, article, acquisition source, sessions, referral-clicking sessions if available, platform leads, approved commissions and paid commissions. Add a notes column for tests, outages and tracking changes. Mark unavailable values as unknown rather than zero.
Compare the same period and definitions. If your analytics only provides raw click events, report clicks per session and explain that repeated clicks are possible. Do not label that number as the percentage of people who clicked.
Work through a transparent example
Illustrative numbers only
Suppose one article has 100 sessions, 8 of those sessions include a referral click, and the affiliate dashboard reports 1 lead in the same week. The session click rate is 8 ÷ 100 = 8%. You cannot confidently claim that the lead came from those eight sessions unless your tracking can connect them.
Different reporting delays, attribution rules and browser settings can separate the systems. Keep platform reports beside site analytics instead of forcing them to match. Do not add traffic totals from two properties that might track the same website.
Choose one repair from the evidence
- Little traffic: check that useful pages are linked and find an appropriate place to share them.
- Visits but few recommendation clicks: inspect whether the article answers the reader’s question and explains who the tool suits.
- Clicks but no reported leads: verify the destination and referral ID before rewriting the article.
- Leads but no purchases: consider audience fit, the product’s free option and the time needed to decide.
- Commission but no payout: check account status, payout conditions and payment details separately.
With only a handful of visits, a change from one click to two is not a reliable trend. Fix clear usability problems immediately, but wait for more comparable observations before calling a copy change a winner.
Completion check
Keep your own tests labelled and separate wherever possible. Respect the site’s analytics consent behaviour; do not bypass a visitor’s choice to fill a report. Never add personal email addresses or customer details to campaign URL parameters.
- You can explain each metric and its source.
- Unknown results are not presented as zero.
- Referrals, purchases and payouts are distinct.
- Your next change addresses one observed problem.
Systeme.io’s affiliate dashboard can be checked for your own reported leads and commissions. The website’s analytics describes on-site behaviour. Neither report on its own proves your content caused a customer’s purchase.
From principle to practice
Denominator means the total you divide by when expressing a rate. It must match the unit and population of the numerator. The useful habit is to make this explicit before adding another tool.
ANNOTATED EXAMPLE · FICTIONAL TEACHING SCENARIO
A small rewrite, a clearer decision
We received eight clicks, so our conversion rate is eight percent.
Eight of 100 measured sessions included a referral click: an 8% session click rate. Platform registrations and purchases are reported separately.
Why it helps: The revision supplies the denominator and specifies the unit. Raw click events can include repeat clicks, so they cannot automatically replace sessions with a click.
Write one metric definition before looking at results. Record the source, time range, timezone, numerator and denominator. Note tests or consent-related gaps before comparing weeks.
Do not subtract an unknown from a known total and label the result lost customers. Missing measurement is not evidence of rejection.
Keep a record of what you changed. Separate what you observed from what you hope will happen. The worksheet below gives you a place to write the decision, test result and next action.
Can I judge a new page after a few visits?
Use a small sample to find obvious usability problems, but avoid treating one extra click as a stable trend. Record more comparable observations before attributing a change to your writing.
YOUR FREE COMPANION
Make this lesson your own
Download eight guided prompts for this task, or print the complete six-lesson workbook. No signup. No email gate. Save your answers in your own files.
Free to adapt for your own business. Examples are teaching aids, not legal forms or guaranteed business outcomes.
Where Systeme.io fits
Use Systeme.io for the platform-side records available to your account and site analytics for on-site behaviour. A small reconciliation sheet keeps the limits visible.
You still supply the offer, useful content, visitors and customer care. Software does not guarantee customers or income.
Explore Systeme.ioWe may earn a commission if you buy through this link, at no extra cost to you. How recommendations are funded.
Sources and scope
Editorial teaching examples; not a report of a completed customer project or an end-to-end account test. Prepared 8 October 2026.
Check current official plan limits and billing options before choosing a subscription. No paid plan is required to complete the planning exercises. This guide does not quote prices or promise that every feature is included in your plan.